Three Rankings, One Model, Little Agreement: Feature Importance Is a Question, Not a Number
I ranked the same 30 features three ways on one random forest. The top fives overlapped by 4 of 5, 2 of 5 and 2 of 5, and the full rankings correlated at 0.27, -0.36 and -0.10. The methods do not disagree about the data. They answer different questions.
 Ibrahim Denis FofanahData Scientist & AI Researcher15 min read·From Notebook to Production · Analysis
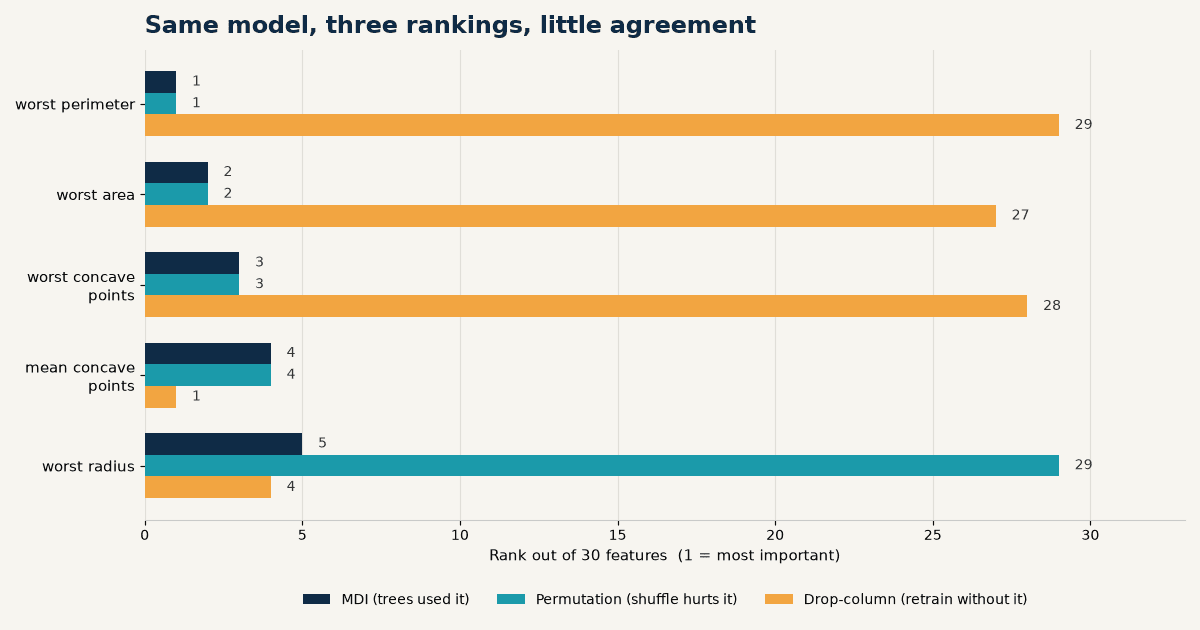
The feature importance bar chart is the most quoted plot in applied machine learning. It appears in model reviews, stakeholder decks and papers, usually with no note about which method produced it. The chart looks like a fact about the data. It records what one method did to one model on one split, and different methods disagree by more than most people expect.
I measured the disagreement directly. One dataset, one model, three methods, same split. The dataset is the Wisconsin diagnostic breast cancer set that ships with scikit-learn: 569 rows, 30 numeric features, 62.7% benign in the dataset encoding. The model is a random forest with 300 trees, trained on a stratified 75/25 split (seed 42), so the test set has 143 rows with 90 positives. The model scores AUC 0.9949 and accuracy 95.8% (137 of 143) on that test set. Then I ranked the 30 features three ways.
The three methods
The three methods answer three different questions, and that is the whole story. Most confusion about feature importance comes from treating them as three estimates of one thing.
MDI (mean decrease in impurity) asks: how much did the trees use this feature? It is feature_importances_ in scikit-learn. Every time a tree splits on a feature, the impurity reduction from that split is credited to the feature, averaged over all trees. It is computed on the training data, it costs nothing extra, and it is the default in most tutorials.
Permutation importance asks: how much does the test score fall when I scramble this feature? It shuffles one column of the test set, re-scores, and records the drop, repeated 10 times here with AUC as the score. It is computed on held-out data and it measures the model as fitted, not the data in the abstract.
Drop-column importance asks: how much does the score fall if I retrain the model without this feature? It trains 30 fresh forests, each missing one feature, and records the AUC drop against the full model. It is the most expensive of the three and the closest to the question people usually mean when they say "how important is this feature": what do I lose by not having it?
from sklearn.datasets import load_breast_cancer
from sklearn.ensemble import RandomForestClassifier
from sklearn.inspection import permutation_importance
from sklearn.metrics import roc_auc_score
from sklearn.model_selection import train_test_split

X, y = load_breast_cancer(return_X_y=True)
X_train, X_test, y_train, y_test = train_test_split(
    X, y, test_size=0.25, random_state=42, stratify=y)

model = RandomForestClassifier(n_estimators=300, random_state=42, n_jobs=-1)
model.fit(X_train, y_train)
base_auc = roc_auc_score(y_test, model.predict_proba(X_test)[:, 1])  # 0.9949

mdi = model.feature_importances_

perm = permutation_importance(model, X_test, y_test, n_repeats=10,
                              random_state=42, scoring="roc_auc", n_jobs=-1)

drop = []
for i in range(X.shape[1]):
    keep = [j for j in range(X.shape[1]) if j != i]
    m = RandomForestClassifier(n_estimators=300, random_state=42, n_jobs=-1)
    m.fit(X_train[:, keep], y_train)
    drop.append(base_auc - roc_auc_score(y_test, m.predict_proba(X_test[:, keep])[:, 1]))
Finding 1: the top fives agree at the top, then diverge
The three top fives share a core and then split. MDI and permutation agree on 4 of 5. MDI and drop-column agree on 2 of 5. Permutation and drop-column agree on 2 of 5.
| Rank | MDI | Permutation (AUC drop) | Drop-column (AUC drop) |
|---|---|---|---|
| 1 | worst perimeter, 0.146 | worst perimeter, +0.0044 | mean concave points, +0.0016 |
| 2 | worst area, 0.144 | worst area, +0.0041 | worst texture, +0.0012 |
| 3 | worst concave points, 0.115 | worst concave points, +0.0037 | mean symmetry, +0.0009 |
| 4 | mean concave points, 0.098 | mean concave points, +0.0018 | worst radius, +0.0008 |
| 5 | worst radius, 0.072 | worst texture, +0.0014 | mean fractal dimension, +0.0007 |
Four features appear in all three top fives in some order: worst perimeter, worst area, worst concave points and mean concave points. That is the stable core, and it is worth saying plainly: the methods do not disagree about everything. They agree that the size and shape of the worst nucleus carry the signal. Everything below that core is where they part ways. MDI puts worst radius fifth. Drop-column puts it fourth. Permutation puts it 29th out of 30, with a measured effect of -0.0003, which is zero within its own noise (standard deviation 0.0011 across the 10 repeats).
Look at the scale of the numbers, not just the order. MDI gives the top feature a share of 0.146 and the top five together take 0.575 of all importance. Permutation gives its top feature 0.0044 AUC. Drop-column gives its top feature 0.0016 AUC. These are different units measuring different things, and the MDI shares look decisive only because MDI always sums to 1. Some feature has to be first. The ranking is forced to look confident even when the underlying effects are tiny.
Finding 2: across all 30 features, the rankings barely correlate, and one pair correlates negatively
Top-five overlap flatters the agreement. The full rankings tell a harsher story. Spearman rank correlation across all 30 features: MDI vs permutation 0.27, permutation vs drop-column -0.10, MDI vs drop-column -0.36. The MDI ranking and the drop-column ranking are negatively correlated. The features MDI ranks highest tend to be the ones whose removal costs the least when the model is retrained.
Worst radius is the clearest case. MDI ranks it 5th (share 0.072). Permutation ranks it 29th (effect -0.0003). Drop-column ranks it 4th (effect +0.0008). All three numbers are correct answers to different questions, and they point in different directions. MDI says the trees split on worst radius a lot. Permutation says shuffling it on the test set changes nothing. Drop-column says retraining without it costs 0.0008 AUC, which is the fourth largest cost among 30 features and still essentially nothing.
The same pattern repeats down the list. Mean perimeter: MDI rank 7, permutation rank 30, drop rank 25. Mean radius: MDI rank 6, permutation rank 25, drop rank 7. Mean area: MDI rank 9, permutation rank 26, drop rank 24. Area error: MDI rank 11, permutation rank 28, drop rank 23. The size features are the ones MDI loves and permutation ignores. That is not a coincidence. It is the correlation structure of the data, which is the next finding.
Finding 3: the size features are near-copies of each other, and MDI spreads credit across copies
Worst radius, worst perimeter and worst area are almost the same variable wearing three names. Their pairwise correlations in the full dataset: worst radius vs worst perimeter 0.994, worst radius vs worst area 0.984, worst perimeter vs worst area 0.978. Mean radius vs mean perimeter is 0.998. Mean concave points vs worst concave points is 0.910.
A random forest splits on whichever copy happens to be available at a node, so MDI spreads the credit across all the copies. Worst perimeter gets 0.146, worst area 0.144, worst radius 0.072, mean perimeter 0.056, mean radius 0.061. Add up the size family and it dominates the chart. But permutation shuffles one copy while the other copies stay intact, so the model barely notices: the shuffled information is still present under another name. That is why permutation ranks worst radius 29th and mean perimeter 30th. The information is important. The individual column is not, because its siblings carry the same information.
This is a known property, not a new discovery. Strobl and co-authors showed in 2007 that random forest importance measures are biased toward correlated predictors, and their 2008 follow-up proposed a conditional permutation scheme that permutes a feature only within groups of similar values of its correlated partners, so the credit is not diluted across copies. The scikit-learn documentation for permutation importance makes the same point in plainer language: correlated features can mask each other, and a feature can look unimportant simply because a correlated partner carries the same signal.
The practical consequence is simple. If your features are correlated, and in real tabular data they usually are, a single importance ranking will mislead you about which columns you can drop. MDI will tell you the family matters and overstate each member. Permutation will tell you each member is dispensable and understate the family. Both are right about the question they asked.
Finding 4: by the drop-column standard, almost no single feature matters
Drop-column is the method that answers the question people usually mean: what do I lose by not having this feature? The answer here is: almost nothing, for any single feature. The largest drop from removing one feature is 0.0016 AUC (mean concave points). The smallest is -0.0007, meaning the model got slightly better without that feature. Nine of the 30 features have a drop of zero or less: removing them cost nothing or helped. The median feature costs a few ten-thousandths of AUC.
That is what a model with AUC 0.9949 on 30 correlated features should look like. There is very little score left to lose, and every feature has a substitute. Drop-column is honest about that. MDI is not, because MDI always sums to 1 and always produces a confident-looking ranking even when every feature is replaceable.
Permutation tells a similar story from the other side. Twenty-seven of the 30 features have a permutation importance of 0.002 AUC or less. Six are negative: shuffling them improved the test score, which is noise, not signal. Thirteen of the 30 have an effect within one standard deviation of zero across the 10 repeats. On a 143-row test set, an AUC change of 0.001 is about the size of one row changing its rank order. Most of the permutation chart is noise drawn as bars.
Finding 5: the disagreement is the method, not the seed
One obvious objection: maybe the rankings disagree because the model is unstable across seeds. I checked. Permutation importance was recomputed for forests trained with seeds 7 and 123, same split, same test set. The top five overlapped 4 of 5 with the seed 42 top five in both cases. The stable core (worst perimeter, worst area, worst concave points, mean concave points) held in all three. The disagreement between methods is much larger than the disagreement between seeds of the same method.
That matters because it rules out the easy fix. You cannot resolve the MDI vs drop-column disagreement by averaging over seeds or by picking a better seed. The methods measure different things, and no amount of averaging makes them measure the same thing.
What this means for data and AI practitioners
- Name the method every time you show a ranking. "Feature importance" without a method name is not a result. MDI, permutation and drop-column are three different quantities. A chart labelled with the method is honest. A chart without one invites the reader to assume the ranking is a property of the data.
- Use MDI for what it is: a debugging view of the model, not a ranking of the data. MDI tells you which features the trees split on. That is useful when you want to know whether the model is leaning on a leaky feature or a proxy you did not intend. It does not measure how much the model needs a feature.
- Use permutation importance with the standard deviation attached, and on a test set large enough to support it. If the effect is smaller than its own standard deviation, say so. Thirteen of my 30 features were in that position. A bar chart without error bars hides exactly the information that decides whether the ranking means anything.
- Use drop-column when the decision is about dropping a column. It is the only one of the three that retrains, so it is the only one that measures the cost of absence rather than the cost of corruption. It is expensive (30 retrains here, each a few seconds), so run it on the shortlist from the cheaper methods, not on all features every time.
- Group correlated features before you rank them. Worst radius, worst perimeter and worst area are one signal in three columns. Rank the group, or drop two of the three and rank what is left. Ranking correlated columns individually and then acting on the ranking is how teams delete a useful feature because its twin absorbed the credit.
- Distrust any ranking that looks too decisive on a near-ceiling model. If your AUC is 0.99, no single feature can matter much, because there is almost nothing left to lose. A chart that still shows a clear winner is showing you the method's forced ranking, not the data's structure.
In favour
The stable core is real. Four features (worst perimeter, worst area, worst concave points, mean concave points) sit in every top five, and the permutation top five reproduces across model seeds. When three methods and three seeds agree on the same small set, that set is worth trusting. The disagreement is concentrated in the middle and bottom of the ranking, where the effects are near zero anyway. For the common use case of "which three features should I look at first", the methods mostly agree.
Against
The experiment is narrow in every dimension that matters. One dataset, and a friendly one: clean, numeric, no missing values, no categorical features, no leakage to catch. One model class, random forest, which is the model where MDI is most familiar and most biased. One split, one test set of 143 rows, so the permutation and drop-column effects are measured with a coarse ruler. The drop-column effects are so small (max 0.0016) that their exact order is itself noise; ranking them is ranking noise, and the article should not be read as claiming mean concave points is truly the most droppable feature in any general sense. A second dataset with uncorrelated features would likely show much higher agreement, and would be the right follow-up.
What would make me wrong
- If the same three methods on a dataset with uncorrelated features still gave a Spearman correlation near -0.36 between MDI and drop-column, my explanation (correlation drives the disagreement) would be wrong, and something about the methods themselves would be at fault.
- If permutation importance on a larger test set (say 5,000 rows) showed large, stable effects for the size features that are near zero here, then the near-zero permutation effects in this piece would be an artifact of the small test set, not of the correlation structure.
- If drop-column importance with a different model class (for example gradient boosting, or a linear model) ranked the same features in the same order as MDI, then the disagreement would be specific to random forests rather than a general property of the methods.
- If a grouped permutation importance (permuting the whole size family at once) gave a small effect, then the family itself would be unimportant and the stable core would be an artifact of the ranking, not of the data.
The verdict
Feature importance is not one number. It is at least three numbers, each answering a different question: what did the model use, what breaks the fitted model when corrupted, and what does retraining without it cost. On one random forest those three numbers agreed on the top four features and disagreed almost everywhere else, with a rank correlation of -0.36 between the two most commonly quoted methods. The right response is not to pick a favourite method and defend it. It is to match the method to the decision: MDI to debug the model, permutation to audit the fitted model on held-out data, drop-column to decide what to delete. And to group correlated features before ranking any of them, because a ranking of near-copies is a ranking of accidents.
Key takeaways
- MDI, permutation and drop-column importance are three different quantities. Name the method or the ranking means nothing.
- On one random forest, the top fives overlapped 4 of 5 (MDI vs permutation) but only 2 of 5 (MDI vs drop-column, permutation vs drop-column).
- The full-rank correlation between MDI and drop-column was -0.36. The features MDI ranked highest tended to cost the least when removed.
- Worst radius, worst perimeter and worst area correlate at 0.98 or above. MDI spreads credit across the copies; permutation ignores each copy because its siblings carry the same signal.
- By the drop-column standard, no single feature matters much: the largest cost of removing one feature was 0.0016 AUC, and 9 of 30 features cost zero or less.
- The disagreement is the method, not the seed: permutation top fives overlapped 4 of 5 across three model seeds.
Which method do you reach for first when someone asks "which features matter", and has it ever given you an answer you later regretted?
Related on Everyday Data Science: Scaling Gave SVM 8 Points and Trees Nothing. I Ran Four Models Raw and Scaled. · Same Model, Ten Seeds, a 3.5-Point Swing: Why One Split Is Not a Result · Five Leaks That Inflate Your AUC: I Measured Each One
Sources: scikit-learn, permutation importance · scikit-learn, feature importance in random forests · Strobl et al., Bias in random forest variable importance measures, BMC Bioinformatics 2007, 8:25 · Strobl et al., Conditional variable importance for random forests, BMC Bioinformatics 2008, 9:307
Serving a Model: Endpoint, Batch, or Embedded?
Next →Drift Is Three Different Failures, and One Metric Cannot See Them All
About the writer
Data Scientist & AI Researcher
Data scientist and AI researcher at Pace University. I coined Artificial Frictional Unemployment, and built the first machine learning model for crop yield prediction in Sierra Leone. Author of Understanding Agentic AI. I write about agentic systems and applied ML, with a bias toward what actually works, and who gets left out when it doesn't.
Found this useful? Passing it on to someone who builds is the best way to help the publication grow.
Built something worth sharing? Write it up for us →