Excel or Python First? What Data Analyst Job Postings Actually Say
Excel appears in 60% of postings, Python in 50%, but the skill that really gets you hired is neither
 Ibrahim Denis FofanahData Scientist & AI Researcher5 min read·Career · Data Analyst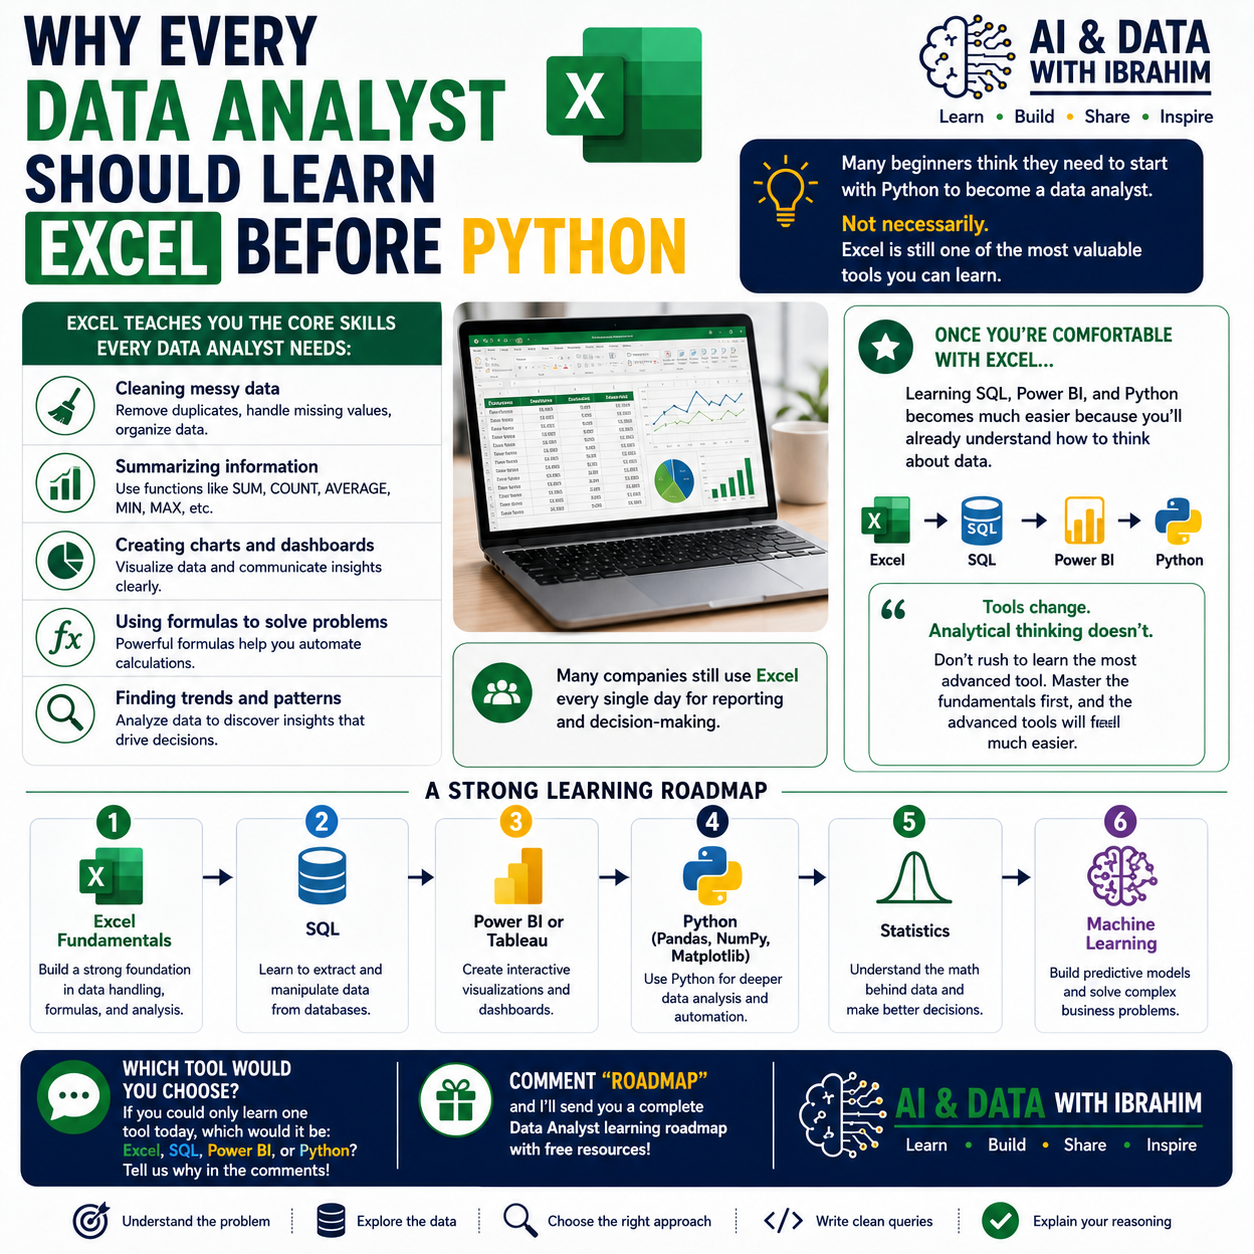
Should I Learn Python First?
It's the most common question I get, and the honest answer annoys everyone: no, but not for the reason you think.
Most people arguing about Excel versus Python are arguing about which tool is more powerful. That's the wrong question. Here's what the job postings actually say, and what the data quietly reveals about the mistake that costs beginners the most time.
What employers actually ask for
Everyone has an opinion about this. Postings have data.
Skill Appears in… SQL 80%+ of data analyst postings Excel / Sheets 60%+ Python or R ~50%
Two things fall straight out of that table.
Excel is not dead. It appears in more postings than Python. The people telling beginners to skip it are giving advice that the job market does not support.
But Excel isn't the top skill either. SQL is, by a wide margin, and it isn't close.
Why you should still start with Excel
Not because it's the most in-demand. Because of what it teaches.
Excel forces you to do, by hand, the five things every analyst does forever:
- Clean messy data: deduplicate, handle blanks, fix inconsistent entries
- Summarize: count, average, group, pivot
- Visualize: build a chart that actually says something
- Solve business problems with formulas: turn a question into a calculation
- Find patterns: spot the trend that changes a decision
Do that in a spreadsheet where you can see every row and something clicks that never quite clicks in code: you learn what data actually is. You develop a feel for shape, for what "wrong" looks like, for when a number is lying to you.
Start in Python and you'll spend your first three months fighting environment errors, indentation, and SettingWithCopyWarning, while learning nothing about analysis.
:::tip The real value of Excel isn't Excel. It's that it teaches you to think about data with the tool out of the way. Once you know what you're trying to do, learning to do it in SQL or Python is mostly syntax. That's a much smaller problem than it looks. :::
The mistake nobody warns you about
Here's where the standard "learn Excel first" advice goes wrong, and where the data is unambiguous.
The danger isn't starting in Excel. It's staying in Excel.
Excel is comfortable. You can see everything. You get results in minutes. And because it works, thousands of aspiring analysts spend two years mastering advanced formulas, macros, and VBA, building genuine expertise in a tool that appears in 60% of postings while ignoring the one that appears in over 80%.
:::warning SQL is the highest-leverage skill in the entire roadmap, and most beginners get to it far too late.
It's in more postings than any other tool. It's the shortest to learn of the three, the useful 20% of SQL is genuinely a weekend. And it's the one that separates "I can analyse a spreadsheet someone sent me" from "I can go and get the data myself."
Excel is the on-ramp. SQL is the job. Do not spend a year on the on-ramp. :::
If you take one thing from this article: give Excel six weeks, not six months. The moment you can clean, pivot, and chart without looking things up, leave. Go to SQL.
The roadmap that actually works
Six steps, and each one exists for a reason.
1. Excel fundamentals (~6 weeks) Cleaning, formulas, pivot tables, charts. Enough to answer a real business question. Then stop.
2. SQL (the big one, 80%+ of postings) SELECT, WHERE, GROUP BY, JOIN, HAVING. Master these five and you can answer most questions companies actually ask. This is where your employability jumps.
3. Power BI or Tableau Because an insight nobody can see is an insight nobody acts on. Pick one. Not both.
4. Python (pandas, NumPy, Matplotlib) Now Python is easy, because you already know what a join is, what a group-by does, what clean data looks like. You're learning syntax, not concepts.
5. Statistics The part everyone skips and every senior analyst wishes they hadn't. Knowing why a number is significant is what turns a report into a decision.
6. Machine learning Only now. And honestly, most data analyst jobs never require it. Chase it because you're curious, not because you think it's the ticket.
Tools change. Analytical thinking doesn't.
Excel has been "dying" for fifteen years and appears in 60% of job postings. Python was going to replace everything and sits at 50%. Meanwhile SQL, a language from the 1970s, is in 80%+ and shows no sign of moving.
The people who last in this field aren't the ones who chased the newest tool. They're the ones who learned to ask a sharp question, get the right data, and explain the answer to someone who doesn't care about your tech stack.
Master the fundamentals. The advanced tools get much easier, and they're the part that changes anyway.
Key takeaways
- Excel beats Python on demand: 60%+ of postings vs ~50%. Starting with it is defensible.
- But SQL beats everything: 80%+, and it's the fastest of the three to learn. It's the highest-leverage move you can make.
- Excel's value is conceptual. It teaches you what data is, with the tool out of the way.
- The real trap is staying in Excel. Six weeks, not six months. Then go.
- Learn in this order: Excel → SQL → BI tool → Python → Statistics → ML. Each one makes the next easier.
If you could only learn ONE tool today, Excel, SQL, Power BI, or Python, which would it be, and why? 👇
Skill-demand figures are drawn from analyses of 2025–26 data analyst postings across LinkedIn, Indeed and related job data. Percentages vary by source, region and seniority, treat them as the shape of the market, not precise measurements. The ordering (SQL > Excel > Python) is consistent across the sources I've seen.
About the writer
Data Scientist & AI Researcher
Data scientist and AI researcher at Pace University. I coined Artificial Frictional Unemployment, and built the first machine learning model for crop yield prediction in Sierra Leone. Author of Understanding Agentic AI. I write about agentic systems and applied ML, with a bias toward what actually works, and who gets left out when it doesn't.
Found this useful? Passing it on to someone who builds is the best way to help the publication grow.
Built something worth sharing? Write it up for us →