98% Accurate and Useless: Six Imbalance Fixes, Measured on a 2% Positive Class
A baseline logistic regression caught 1 of 59 positives. Class weights and downsampling caught 45 but cried wolf 700 times. The only fix that improved F1 cost nothing: moving the threshold.
 Ibrahim Denis FofanahData Scientist & AI Researcher11 min read·From Notebook to Production · Analysis
Fraud, churn, disease, defects. The datasets that matter most in production are usually the ones where the thing you care about barely shows up. A model can be 98% accurate on such data and still be useless, because accuracy rewards saying no to everything.
I wanted to know how far the standard fixes actually get you, so I ran six of them on one dataset and measured everything. No theory, just counts.
The setup
I generated a fraud-like binary dataset with scikit-learn 1.9.1: 10,000 rows, 20 features, 8 informative, 2% positive class, 1% label noise. The final split was 7,500 training rows with 177 positives and 2,500 test rows with 59 positives. Seed 42 throughout, one fixed split, stratified. The positive class is the rare event, the thing a production model exists to catch.
from sklearn.datasets import make_classification
from sklearn.model_selection import train_test_split

X, y = make_classification(
    n_samples=10000, n_features=20, n_informative=8, n_redundant=4,
    n_clusters_per_class=2, weights=[0.98, 0.02], flip_y=0.01,
    random_state=42)
X_train, X_test, y_train, y_test = train_test_split(
    X, y, test_size=0.25, stratify=y, random_state=42)
Six models, all evaluated on the same held-out 2,500 rows:
- Baseline logistic regression, threshold 0.5
- Logistic regression with
class_weight="balanced", threshold 0.5 - Baseline logistic regression with the threshold tuned on the training set (max F1)
- Logistic regression trained on a downsampled 50/50 training set, threshold 0.5
- Random forest, 300 trees, default settings, threshold 0.5
- Random forest with
class_weight="balanced_subsample", threshold 0.5
The threshold for model 3 was picked with precision_recall_curve on the training data only, then applied to the test set untouched. Tuning a threshold on the test set would be leakage of the same kind I measured in an earlier piece, so the rule here was simple: the test set decides nothing, it only reports.
The results
| Model | Accuracy | Precision | Recall | F1 | ROC-AUC | PR-AUC | Predicted positive | Caught |
|---|---|---|---|---|---|---|---|---|
| Baseline LR (0.5) | 0.977 | 1.000 | 0.017 | 0.033 | 0.795 | 0.272 | 1 | 1 of 59 |
| Balanced LR (0.5) | 0.712 | 0.060 | 0.763 | 0.111 | 0.795 | 0.097 | 752 | 45 of 59 |
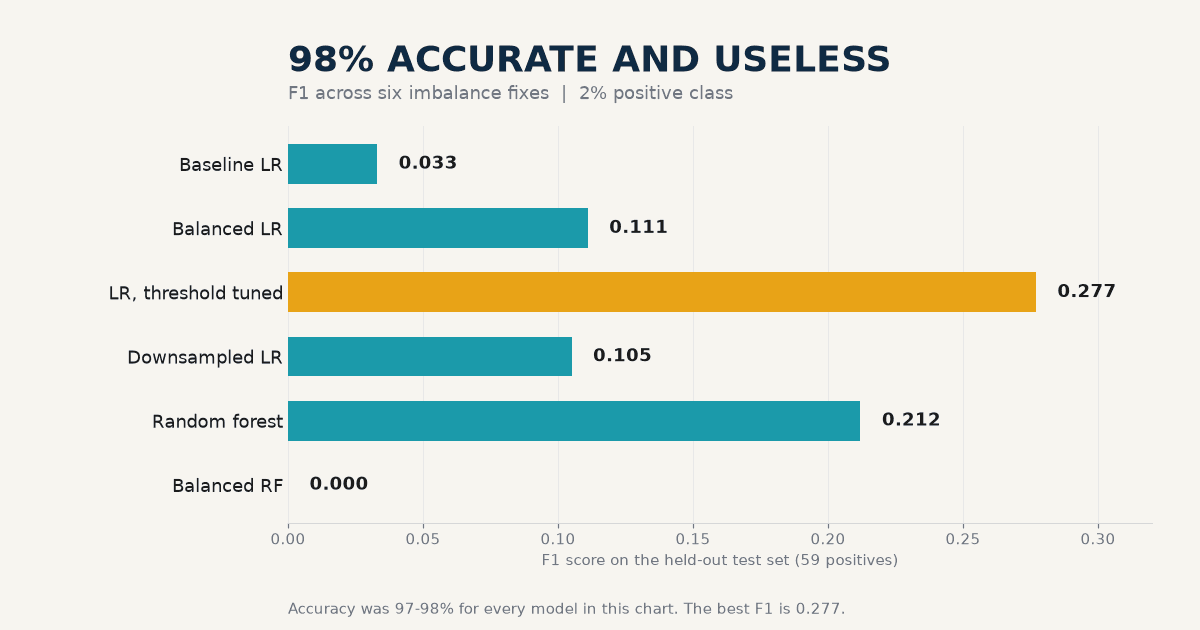
| Baseline LR, tuned threshold 0.117 | 0.971 | 0.333 | 0.237 | 0.277 | 0.795 | 0.272 | 42 | 14 of 59 |
| Downsampled LR (0.5) | 0.692 | 0.056 | 0.763 | 0.105 | 0.782 | 0.084 | 800 | 45 of 59 |
| Random forest (0.5) | 0.979 | 1.000 | 0.119 | 0.212 | 0.873 | 0.404 | 7 | 7 of 59 |
| Balanced RF (0.5) | 0.976 | 0.000 | 0.000 | 0.000 | 0.897 | 0.465 | 0 | 0 of 59 |
A classifier that predicts the majority class every time scores 97.6% accuracy on this test set. Keep that number in mind while reading the table. Every model in it is within a point of that dummy score.
Finding 1: Accuracy is a decoy, and the baseline proves it
The baseline logistic regression scored 97.7% accuracy, the second highest in the table, and caught exactly 1 of 59 positives. Its precision was a perfect 1.000, which sounds excellent until you see what it cost: it flagged a single row in 2,500 and happened to be right. A model that never flags anything would score 97.6% and catch none. The baseline is barely better than doing nothing, and accuracy cannot tell the difference.
This is the failure mode that ships to production. A dashboard shows 97.7%, a stakeholder nods, and the model catches nothing for months because nobody looked at recall.
Finding 2: Class weights buy recall at a steep price, and they damage ranking
Adding class_weight="balanced" to the logistic regression moved recall from 1.7% to 76.3%. It caught 45 of 59 positives. The price: 752 flagged rows, 707 of them false alarms, precision 6.0%. Accuracy fell to 71.2%, which is the honest reflection of that trade. If a human reviews every flag, that is 707 wasted reviews per 45 catches.
The quieter damage is in the ranking. PR-AUC fell from 0.272 to 0.097. The weighted model does not just lower the threshold, it refits the coefficients with the minority class upweighted about 42 to 1, and on this data that reshuffled the ranking itself. ROC-AUC barely moved, 0.795 to 0.795, which is exactly why ROC-AUC is the wrong metric to watch here: it is insensitive to the thing that changed. If you only tracked ROC-AUC, you would conclude class weights changed nothing. They changed a lot.
Finding 3: Downsampling is the same trade in different clothes
Training on a downsampled 50/50 set produced nearly identical numbers to class weights: recall 76.3%, precision 5.6%, F1 0.105, 800 flagged rows. That makes sense. Both approaches tell the model the minority class matters more; one does it by reweighting the loss, the other by deleting majority rows. The overlap is the point. If you have tried one and were unhappy with the false alarm rate, the other will not save you. They are two implementations of the same decision.
Downsampling has one extra cost worth naming: it threw away about 7,100 majority training rows. On a small real dataset, that deleted information is gone, not just downweighted.
Finding 4: Threshold tuning was the only fix that raised F1
The baseline model, with its threshold moved from 0.5 to 0.117, chosen on the training set by maximizing F1, scored F1 0.277 on the test set. That is more than eight times the baseline F1 of 0.033 and better than every other approach in the table. It flagged 42 rows, caught 14 of 59 positives, at 33.3% precision, and kept accuracy at 97.1%.
Two things matter here. First, the threshold was chosen without touching the test set, and it transferred: the training F1 at that threshold was 0.253, the test F1 was 0.277. Second, tuning the threshold does not change the model at all. It changes where you draw the line on scores the model already produced. The ranking, ROC-AUC and PR-AUC are identical to the baseline. All the gain came from admitting that 0.5 is an arbitrary default, not a law.
Tuning the threshold on the balanced logistic regression instead gave F1 0.174, worse than tuning the plain baseline. Once class weights had damaged the ranking, no threshold could fully repair it. Fix the decision rule before you distort the fit.
Finding 5: The best-ranking model predicted nothing
The balanced random forest had the best ROC-AUC in the test at 0.897 and the best PR-AUC at 0.465. It also predicted zero positives at threshold 0.5. Its highest predicted probability on the entire test set was 0.473. Every score sat below the line, so the model flagged nothing, caught nothing, F1 0.000.
That looks like a contradiction until you separate ranking from deciding. AUC measures whether positives score above negatives. A threshold measures whether any score crosses 0.5. Averaging 300 trees pulls every probability toward the middle, and with balanced_subsample the averaging pulled them all just under the line. The ranking was the best in the test and the decisions were empty.
I checked whether threshold tuning rescues it. The best training-set threshold was 0.583, above the highest test probability of 0.473, so even the tuned version scores F1 0.000 on this test set. The train and test probability scales drifted apart, which is its own warning: a threshold tuned on one sample is only as good as the stability of the scores it was tuned on. With 177 training positives, that stability is thin.
What this means for data and AI practitioners
- Report PR-AUC, not ROC-AUC, on imbalanced data. ROC-AUC stayed flat at 0.795 while PR-AUC fell from 0.272 to 0.097 under class weights. The metric that moved was the one that mattered.
- Always show the raw counts. Precision, recall and F1 are ratios. "Caught 45 of 59, flagged 752" is the sentence a stakeholder can act on. Ratios hide the review workload.
- Tune the threshold on training or validation data, never on test. The 0.117 threshold was picked on train and held up on test. Picking it on test would have been leakage dressed up as tuning.
- Check the maximum predicted probability before trusting a fix. The balanced forest never produced a score above 0.473. A one-line check would have caught that before deployment.
- Try the threshold before the weights. Moving the line costs nothing, keeps the ranking intact, and here it beat both class weights and downsampling on F1. Distort the fit only when the ranking itself is the problem.
- Price the false alarms. 707 false alarms per 45 catches is a staffing decision, not a modelling one. Ask what a review costs and what a miss costs, then pick the operating point from those two numbers, not from a default.
In favour
Threshold tuning is free, transparent, and reversible. The PR-AUC argument is settled theory for imbalanced data, not a preference. And the pattern matches what practitioners report from real fraud systems: the 0.5 default is where most of the damage hides.
Against
One synthetic dataset cannot prove a general rule. Real positives cluster differently, and on data where the classes separate cleanly, class weights can work well. The balanced forest result depends on how forest probabilities average, which varies by implementation. A single split with 59 test positives leaves wide uncertainty around every recall figure in the table, and a different seed could reorder the middle of the pack.
What would make me wrong
- If the same six approaches on a real imbalanced dataset, say credit card fraud or a churn table, show class weights beating threshold tuning on F1 across several seeds, the ranking here was a synthetic artifact.
- If a repeated-split run shows the balanced forest crossing 0.5 regularly, the zero-prediction result was a split quirk, not a property of balanced forests.
- If the PR-AUC drop under class weights disappears with a different solver or regularization strength, the damage I measured was a fitting detail, not a general property of weighting.
The verdict
Nothing in this test made the problem easy. The best F1 in the table is 0.277, which means the best model here still misses three quarters of the positives. That is the honest headline: on hard, rare events, the fixes rearrange the tradeoff, they do not remove it.
Within that tradeoff, the ranking is clear. Threshold tuning first, because it costs nothing and it worked. Class weights and downsampling second, but only when you can afford the false alarms and you have checked that the ranking survived. A balanced forest third, and only after you verify its probabilities actually cross your threshold. Accuracy last, or never. It told us the do-nothing model was excellent, and it was wrong.
Key takeaways
- A 97.7% accurate model caught 1 of 59 positives. Accuracy on imbalanced data is a decoy.
- Class weights lifted recall to 76% but collapsed precision to 6% and cut PR-AUC from 0.272 to 0.097.
- Downsampling gave nearly identical numbers to class weights. They are the same trade, not two fixes.
- Moving the threshold from 0.5 to 0.117, chosen on train, raised F1 from 0.033 to 0.277, the best in the test.
- The balanced random forest had the best AUC and predicted zero positives, because its highest score was 0.473. Ranking is not deciding.
When did you last check what your production model actually flags, rather than what its accuracy says?
Related on Everyday Data Science
- Five Leaks That Inflate Your AUC: I Measured Each One
- Same Model, Ten Seeds, a 3.5-Point Swing: Why One Split Is Not a Result
- Your 0.85 Meant 0.98: A 20,000-Row Calibration Test That Caught a Top Model Misstating Its Own Odds
Sources: scikit-learn precision_recall_curve docs, scikit-learn make_classification docs, scikit-learn LogisticRegression docs, scikit-learn RandomForestClassifier docs, scikit-learn average_precision_score docs
Serving a Model: Endpoint, Batch, or Embedded?
Next →79% Accurate, Give or Take 8 Points: What a Bootstrap Interval Says About Your Test Score
About the writer
Data Scientist & AI Researcher
Data scientist and AI researcher at Pace University. I coined Artificial Frictional Unemployment, and built the first machine learning model for crop yield prediction in Sierra Leone. Author of Understanding Agentic AI. I write about agentic systems and applied ML, with a bias toward what actually works, and who gets left out when it doesn't.
Found this useful? Passing it on to someone who builds is the best way to help the publication grow.
Built something worth sharing? Write it up for us →