The First Question Every Data Scientist Asks: What Does One Row Represent?
Before the join, before the model, before the prompt. Get the unit of analysis wrong and every number downstream is wrong with it.
 Ibrahim Denis FofanahData Scientist & AI Researcher12 min read·Data Thinking · Part 1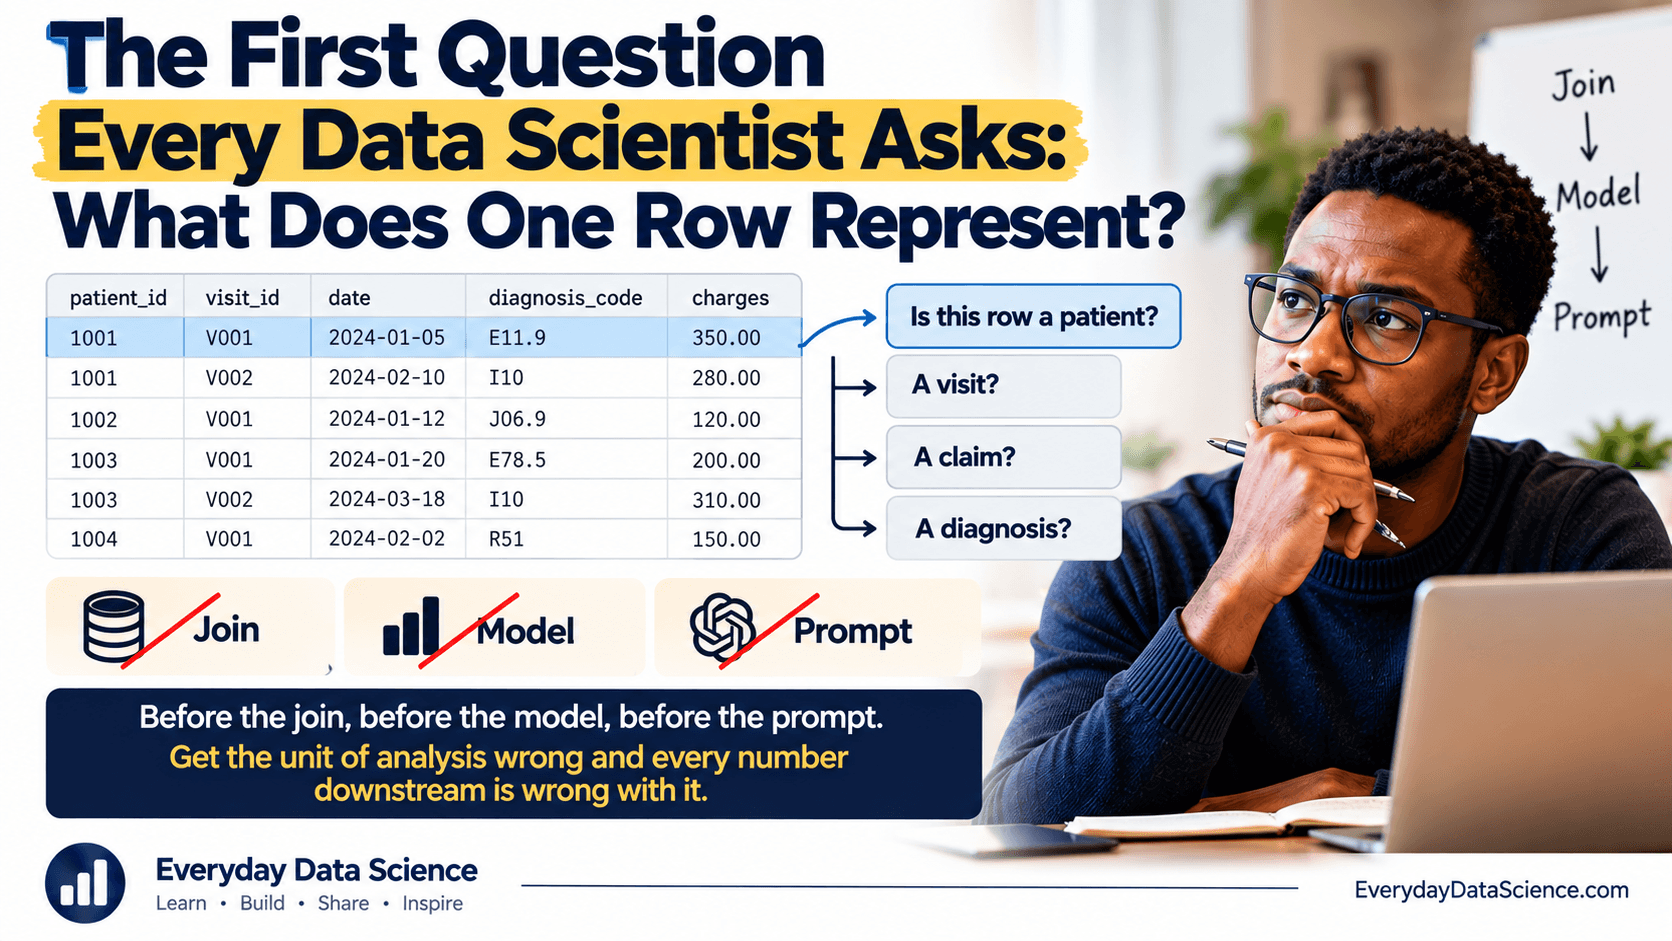
A junior analyst on a team I worked with reported that average order value had dropped from £62 to £41 in a single quarter. Leadership took it seriously. Someone drafted a discount-policy review. Someone else started a deck about basket erosion.
The number was wrong. Not the arithmetic, the arithmetic was fine. The table was wrong.
She had computed the average over a table where one row was one line item, not one order. The business had started selling bundles that quarter, so orders now contained more lines, each line cheaper. Average line value fell. Average order value had actually gone up.
Nothing about the code was broken. Nothing about the data was dirty. The analyst had simply never asked the question that experienced Data Scientists ask before anything else.
Why this matters more than any tool you will learn
You can learn groupby in an afternoon. You can learn window functions in a week. You can now ask an AI assistant to write either one in seconds, and it will write them correctly.
None of that helps if you are aggregating the wrong unit.
The grain of a table is the contract between the data and reality. Get it right and every metric you build on top inherits that correctness. Get it wrong and you produce numbers that are internally consistent, beautifully formatted, fully reproducible, and completely false. Those are the dangerous ones. An error that crashes gets fixed in ten minutes. An error that renders cleanly on a dashboard survives for two years and shapes budget decisions.
This is also the fastest way to spot the difference between someone who has done the job and someone who has done the tutorials. Hand both of them a CSV. The junior opens it and starts plotting. The senior opens it and says: "so one row here is one what?"
The professional mindset: name the row before you touch it
Here is the habit worth building, and it takes about ninety seconds.
Before you load a table into anything, write one sentence in plain English that completes this: In this table, one row represents ______.
If you cannot finish that sentence, you do not yet understand the data, and no amount of df.head() will fix that. You need a person: the engineer who built the pipeline, the ops lead who uses the source system, the person whose team generates the records.
The sentence has to be specific. "One row is a customer" is not the same as "one row is a customer as of the nightly snapshot on the date in snapshot_date". The second one tells you that customers appear many times, that counting rows will overcount customers by a factor of however many days you have loaded, and that a naive join to the orders table will multiply your revenue.
The five questions, in order
This is the framework. Run it on every table, every time, until it becomes automatic.
1. What does one row represent?
The plain-English sentence. One customer. One order. One order line. One customer-month. One page view. One claim. One shift.
2. What combination of columns makes a row unique?
This is the grain key, and it is testable. If you believe one row is one order, then order_id should be unique. Check it. Do not assume it. Half the time you will find your belief was wrong, and finding out now costs nothing.
3. What point in time does the row refer to?
Is it an event that happened at a moment (a transaction), a state that was true over a period (a subscription), or a snapshot of a state as observed on some date (a nightly customer extract)? These three behave completely differently under aggregation, and mixing them is one of the most common sources of double counting.
4. Who is in the table, and who is missing?
A table of customers is almost never a table of all customers. It is usually active customers, or customers with at least one purchase, or customers who have not requested deletion. The filter that was applied upstream is invisible in the file and enormous in its consequences. If churned customers were quietly excluded, your churn model is being trained on people who did not churn.
5. What happens to the grain when I join?
This is where the money is lost. Joining a one-row-per-order table to a one-row-per-order-line table gives you a one-row-per-order-line result, and every order-level value in it is now repeated. Sum that column and you will overstate revenue, silently, with no error and no warning.
A real-world example: churn at a subscription business
Say you are asked to build a churn model for a subscription business. You are handed three tables.
| Table | One row represents |
|---|---|
customers |
one customer, current state, active accounts only |
subscriptions |
one subscription period per customer, with start and end dates |
events |
one product interaction, timestamped |
Run the five questions and the problems appear before you write any code.
customers excludes churned accounts. That is the population question, and it is fatal. Your model needs churners. If you train on this table you have a dataset in which the target variable is always zero.
subscriptions has multiple rows per customer. People pause and resume. A customer who left and came back has two rows. Count rows and you overcount customers. Join naively to customers and every customer attribute duplicates.
events has a completely different grain and no natural alignment. To use it you have to aggregate it up to whatever grain your model needs, which forces the real question: what does one row of your training table represent?
That last one is the decision that defines the whole project. You have at least three defensible options.
- One row per customer. Simple, but throws away time. You can only ask "will this customer ever churn", which is not a question the business can act on.
- One row per customer-month. Each row is a customer as they looked at the start of a month, labelled with whether they churned during it. This is usually the right answer for churn, because it matches how the business operates: monthly reviews, monthly retention budgets.
- One row per subscription period. Useful if you care about contract renewals specifically rather than ongoing attrition.
There is no correct answer in the data. There is a correct answer given what the business will do with the prediction. That is why this step cannot be delegated.
Checking the grain in code
The five questions are conceptual. Three of them are directly testable, and you should test them rather than trust them.
import pandas as pd

subs = pd.read_csv("subscriptions.csv")

# Question 2: is the grain what I was told it is?
# If one row is one subscription period, this key must be unique.
key = ["customer_id", "subscription_start"]
dupes = subs.duplicated(subset=key).sum()
print(f"rows: {len(subs):,}  duplicate keys: {dupes:,}")

# The cheap, honest version of the same check:
print(f"rows: {len(subs):,}  distinct customers: {subs['customer_id'].nunique():,}")
That second line is the one I run first on any table. If rows and distinct entities are the same number, you have one row per entity. If rows are much larger, you have a repeating grain and you now know to be careful with every join and every average that follows.
The same idea in SQL, which is where you will usually meet the problem:
-- Does this table really have one row per order?
select
  count(*)                  as rows,
  count(distinct order_id)  as orders
from orders;
-- rows > orders means order_id is not the grain. Find out what is
-- before you sum anything in this table.
And the check that catches the expensive mistake, run immediately after a join:
orders = pd.read_csv("orders.csv")          # one row per order
lines  = pd.read_csv("order_lines.csv")     # one row per line item

revenue_before = orders["order_total"].sum()

joined = orders.merge(lines, on="order_id", how="inner")

# order_total is now repeated once per line. Summing it inflates revenue.
print(f"true revenue:   {revenue_before:,.2f}")
print(f"naive post-join: {joined['order_total'].sum():,.2f}")

# The correct way to keep an order-level value after a fan-out join:
per_order = joined.groupby("order_id")["order_total"].first().sum()
print(f"deduplicated:   {per_order:,.2f}")
Run that once on real data and you will never forget it. The gap between the first and second number is exactly the size of the error that would have shipped.
The AI perspective
This is worth being precise about, because the honest version helps you more than either the hype or the panic.
What AI can do here, genuinely well. It will write the duplicate-key check faster than you can. It will write the groupby, the window function, the correct anti-join pattern, the pivot from long to wide. It will explain why a fan-out join inflates a sum, with a worked example, at whatever level of detail you ask for. If you paste a schema and say "I need one row per customer-month from these three tables", it will produce a very reasonable first draft of that SQL. Use it for all of this. Typing it yourself is not a virtue.
What AI cannot do. It cannot tell you that the customers table silently excludes churned accounts, because that fact is not in the schema, not in the column names, and not in the data. It is in the head of the engineer who wrote the extract three years ago. It cannot tell you whether churn should be modelled monthly or per contract, because that depends on how your retention team actually works. It cannot know that region was redefined in March and that rows before and after are not comparable. It has never sat in your operations review.
What you must decide. The grain of the training table. The population you are willing to reason about. Whether the row you are about to build corresponds to a decision anyone can actually take. Those three choices determine whether the project is useful, and all three are made before the first line of code.
The pattern generalises: AI is extremely strong on syntax and structure, and blind to context and consequence. Which is a good deal, because syntax was always the cheap part.
Common mistakes
Assuming the grain from the table name. customer_data.csv is a filename, not a contract. I have opened files called customers that had one row per customer per campaign.
Trusting a primary key you did not verify. Columns named id are frequently not unique after an extract, a union, or a partial reload.
Averaging after a fan-out join. The single most common silent error in analytics. Every average is now weighted by the number of child rows, which is a weighting nobody chose.
Mixing events, states and snapshots in one aggregation. Summing a monthly balance snapshot across twelve months does not give you an annual figure. It gives you a number with no meaning.
Building the model table before deciding the grain. If you cannot say what one row of your training data represents, you cannot say what your model predicts, and you will not be able to explain it when someone asks.
Letting the tool pick for you. df.merge() will happily produce a table with a grain nobody intended and no error message. AI will happily write that merge for you. Neither is a decision.
Best practices
- Write the sentence first. One row in this table represents ______. Put it at the top of the notebook.
- Verify the grain key with code, on every table, every time. It takes one line and catches a class of bug that testing never will.
- Restate the grain after every join. Treat a join as a transformation of meaning, not just of shape.
- Ask what was filtered out upstream. Then ask a human, not the data.
- Choose the model grain from the decision, backwards. Start with "what will someone do with this prediction, and how often", and the row falls out of it.
- Keep a data dictionary, however scrappy. One line per table stating the grain. It costs an hour and saves weeks.
- Use AI to write the checks, not to make the call. Ask it for the verification code, then read the output yourself.
Key takeaways
- Every table has a grain, and the grain is the single most important thing about it.
- If you cannot complete the sentence "one row represents ______", you do not understand the data yet, and no tool will rescue you.
- Verify the grain key rather than believing it. One line of code, enormous return.
- Joins create a new grain. Aggregating without noticing is the most common silent error in analytics.
- The grain of a training table encodes what your model is actually predicting. Choose it from the business decision, not from convenience.
- AI writes the query. You decide what the row means. That second part is the job.
Continue the series
This is Part 1 of the Data Thinking Series, which teaches the reasoning that comes before the code.
Next: AI Won't Replace Data Scientists. It Will Replace Lazy Ones. picks up exactly where this leaves off, on the division of labour between what AI does well and what remains yours.
Then: Before You Clean Your Data, Ask This One Question: Is It Actually Dirty? applies the same discipline to missing values, where the reflex to fix comes long before the work of understanding.
If one idea carries through the whole series, it is this: learn the fundamentals, and use AI to accelerate them, not to replace them.
Your turn. Open the table you are working with right now and finish the sentence. One row represents what, exactly? If the answer takes more than a moment, you have found the most valuable thing you will do today.
About the writer
Data Scientist & AI Researcher
Data scientist and AI researcher at Pace University. I coined Artificial Frictional Unemployment, and built the first machine learning model for crop yield prediction in Sierra Leone. Author of Understanding Agentic AI. I write about agentic systems and applied ML, with a bias toward what actually works, and who gets left out when it doesn't.
Found this useful? Passing it on to someone who builds is the best way to help the publication grow.
Built something worth sharing? Write it up for us →