Most Analytics Bugs Are Data Bugs. Five Checks That Catch Them Before the Meeting.
Part 2 of The Practical Data Analyst. A 2,010-row orders table with 50 planted defects, five validation checks in plain pandas, every failure shown with real output: exact duplicates, NULL key columns, negative quantities, future dates, broken line totals, orphan product references. The checks flagged 51 rows. They also missed four near-duplicates whose numbers were internally consistent, which is the honest part.
 Ibrahim Denis FofanahData Scientist & AI Researcher8 min read·Careers & Skills · Tutorial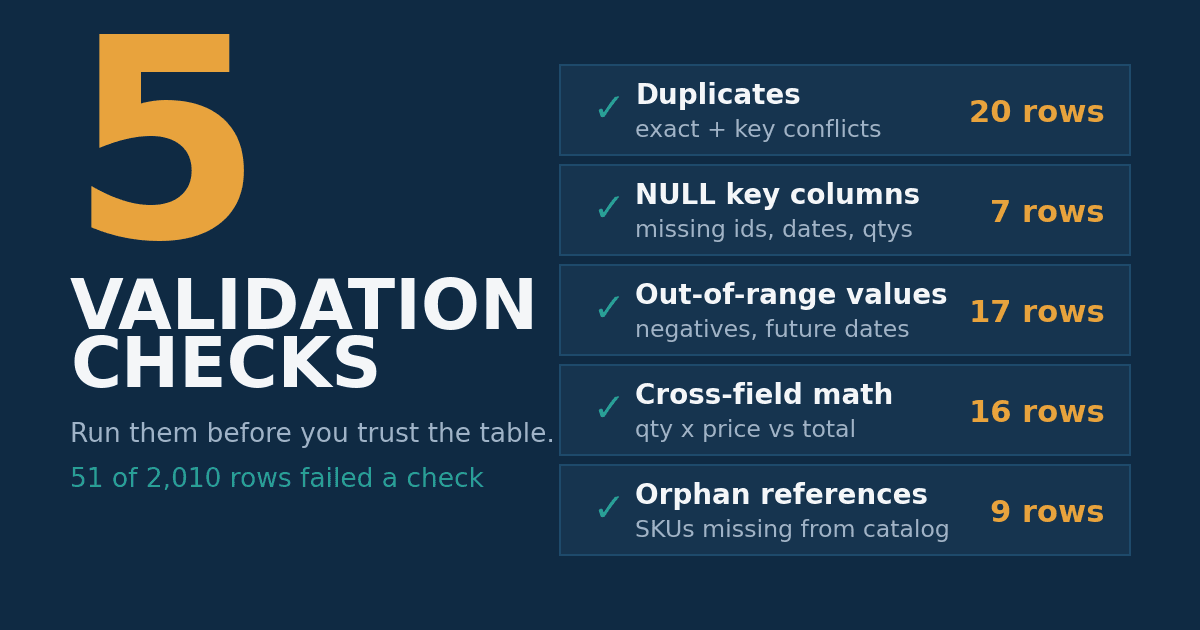
Part 1 of this series gave you five SQL window-function patterns for writing analytics queries. This is the companion habit: check the table before you query it. When an analysis turns out wrong, the query is usually fine and the data is not. Duplicated rows double-count revenue. NULL keys vanish in joins. A negative quantity here and a future date there, and the dashboard is fiction. The fix is not vigilance. It is five checks you run every time, the way a pilot runs a preflight list, because memory is unreliable and defects are not.
To keep this honest, I built a dirty table on purpose: 2,010 rows of order lines plus a small product catalog, with 50 defects planted in seven flavors. Then I ran the checks and kept whatever they found, including the misses.
The setup
The orders table has eight columns: order_id, order_date, product_id, product, quantity, unit_price, line_total, region. The catalog has six products (P001 through P006). Each check is a few lines of pandas and returns the offending rows, so you can read them before you decide what to do about them.
import pandas as pd

orders = pd.read_csv("orders.csv")    # 2,010 rows
catalog = pd.read_csv("catalog.csv")  # 6 products
Check 1: duplicates, both kinds
There are two kinds of duplicates and only one of them is easy to find. Exact duplicates are byte-identical rows. Key duplicates share an order_id but disagree on the data, which is worse: the table now contains two versions of the truth and no marker saying which one is real.
# exact duplicates: identical in every column
exact = orders[orders.duplicated(keep=False)]

# key duplicates: same order_id, conflicting data
key_conflicts = orders[orders.duplicated(subset=["order_id"], keep=False)]
Output: 12 exact-duplicate rows (6 pairs) and 20 rows sharing an order_id across 10 distinct ids. The key-conflict scan found 4 near-duplicate pairs whose quantities had been silently edited, with line totals recomputed to match. Those 4 copies passed every other check in this article. Only the key scan caught them, and even it cannot tell you which copy is the true one.
Check 2: NULLs in key columns
A NULL order_id or order_date is not a data point. It is a hole where a data point should be, and it has a nasty property: inner joins drop NULL keys silently, so your revenue report undercounts and nothing errors.
key_cols = ["order_id", "order_date", "product_id", "quantity"]
nulls = orders[orders[key_cols].isna().any(axis=1)]
Output: 7 rows. Five have NULL quantities, two have NULL order ids:
| order_id | order_date | product_id | product | quantity | unit_price | line_total | region |
|---|---|---|---|---|---|---|---|
| 1013.0 | 2026-05-15 | P002 | Widget B | NaN | 8.00 | 32.00 | West |
| 1133.0 | 2026-02-25 | P003 | Gadget C | NaN | 24.99 | 299.88 | South |
| NaN | 2026-08-08 | P002 | Widget B | 3.0 | 8.00 | 24.00 | East |
| 1906.0 | 2026-03-05 | P003 | Gadget C | NaN | 24.99 | 249.90 | West |
Run this check before you join, not after the numbers look odd. By the time you notice the undercount, you have already presented it.
Check 3: out-of-range values
Some values are impossible for the domain. Quantities and prices should not be negative in a sales table. Dates should not be in the future. These are the cheapest checks to write and they catch the defects that make reports absurd.
bad_range = orders[(orders["quantity"] < 0) | (orders["unit_price"] < 0)]
future = orders[orders["order_date"] > "2026-10-11"]
Output: 9 rows with negative quantities or prices, 8 rows dated after today. One row was both:
| order_id | order_date | product_id | product | quantity | unit_price | line_total | region |
|---|---|---|---|---|---|---|---|
| 1107.0 | 2026-01-18 | P002 | Widget B | -17.0 | 8.00 | 136.00 | West |
| 1188.0 | 2026-07-28 | P003 | Gadget C | 11.0 | -24.99 | 274.89 | North |
| 1356.0 | 2026-11-14 | P005 | Tool E | 17.0 | 49.95 | 849.15 | North |
| 1419.0 | 2026-12-19 | P001 | Widget A | 10.0 | -12.50 | 125.00 | West |
Check 4: cross-field arithmetic
Single-column checks cannot catch a total that disagrees with its own inputs. If line_total should equal quantity times unit_price, verify it. This is the check that finds the defects your eyes skip, because each column looks plausible on its own.
ok = orders.dropna(subset=["quantity", "unit_price"])
bad_math = ok[(ok["line_total"] - ok["quantity"] * ok["unit_price"]).abs() > 0.011]
Output: 16 rows. The tolerance of 0.011 avoids flagging honest rounding; the flagged rows are off by real money, like order 1164, whose total of 439.82 should be 399.84.
One honest detail: 9 of the 16 are the negative-value rows from check 3, where the quantity was negated but the total was left positive. Overlapping checks are normal and fine. Fix the negatives first, re-run, and this list shrinks to the 7 genuinely broken totals.
Check 5: orphan references
Every product_id in the orders table should exist in the catalog. Rows that reference nothing are orphans, and they break the most common operation in analytics: the join. An inner join to the catalog drops them without a sound, and the category report quietly loses their revenue.
orphans = orders[~orders["product_id"].isin(catalog["product_id"])]Output: 9 rows referencing P999, labeled "Unknown SKU":
| order_id | order_date | product_id | product | quantity | unit_price | line_total | region |
|---|---|---|---|---|---|---|---|
| 1344.0 | 2026-02-12 | P999 | Unknown SKU | 8.0 | 24.99 | 199.92 | West |
| 1737.0 | 2026-04-26 | P999 | Unknown SKU | 1.0 | 5.25 | 5.25 | East |
| 1774.0 | 2026-06-26 | P999 | Unknown SKU | 4.0 | 3.10 | 12.40 | North |
| 1816.0 | 2026-06-09 | P999 | Unknown SKU | 16.0 | 12.50 | 200.00 | North |
If your pipeline has a staging step, this is where it belongs: reject or quarantine orphans before they reach the tables anyone queries.
The full scorecard
| Check | What it catches | Rows flagged | What breaks if you skip it |
|---|---|---|---|
| Exact + key duplicates | double-counted rows, conflicting copies | 20 | revenue counted twice; two "truths" for one order |
| NULL key columns | missing ids, dates, quantities | 7 | joins silently drop rows; aggregates undercount |
| Out-of-range values | negatives, future dates | 17 | absurd values in reports; forecasts trained on the future |
| Cross-field arithmetic | totals that disagree with qty x price | 16 | every downstream number inherits the error |
| Orphan references | SKUs missing from the catalog | 9 | inner joins silently drop the rows |
In total, 51 of 2,010 rows failed at least one check: 2.5% of a table that looked perfectly clean. Several rows failed more than one check, which is why the flag counts add up to more than 51.
The verdict
Five checks, about fifteen lines of pandas, under a second on 2,010 rows. They found 51 bad rows in a table that looked fine. That is the entire argument: the cost of running them is minutes, and the defects they find are the kind that end up in front of your manager.
The honest limit matters as much as the catches. Four near-duplicate rows passed every check because their numbers were internally consistent. No validation suite proves data is right. It only proves the data is not wrong in the specific ways you checked. Write the checks anyway, keep the list short enough that you actually run it, and stay suspicious of the table even after it passes.
Key takeaways
- Validate before you analyze, every time. The bugs checks find are the expensive kind, and running them takes minutes.
- Duplicates need two scans: exact rows and conflicting keys. Deleting on exact-match alone keeps the dangerous kind.
- NULLs in key columns are join killers. Check them before you join, not after the numbers look odd.
- Cross-field arithmetic catches what single-column checks cannot. Always allow a rounding tolerance so honest pennies do not drown the real errors.
- Checks prove the absence of known failure modes, not the presence of truth. The four misses are the lesson.
Which check would have caught the last bad number you shipped, and what stopped you from running it?
Related on Everyday Data Science: Window Functions Are SQL's Most Underused Feature. Five Patterns Cover Nearly Everything. (Part 1 of this series) · Pandas vs Polars vs DuckDB on 3.5M NYC Taxi Rows
Sources: pandas.DataFrame.duplicated, pandas.DataFrame.isna, Great Expectations (the expectation-list concept behind these checks)
About the writer
Data Scientist & AI Researcher
Data scientist and AI researcher at Pace University. I coined Artificial Frictional Unemployment, and built the first machine learning model for crop yield prediction in Sierra Leone. Author of Understanding Agentic AI. I write about agentic systems and applied ML, with a bias toward what actually works, and who gets left out when it doesn't.
Found this useful? Passing it on to someone who builds is the best way to help the publication grow.
Built something worth sharing? Write it up for us →